Rowe, L., R. R. Repasky, & A. R. Palmer. 1997. Condition-dependent symmetry in sexually selected traits: Fluctuating asymmetry or antisymmetry? Evolution 51:1401-1408.
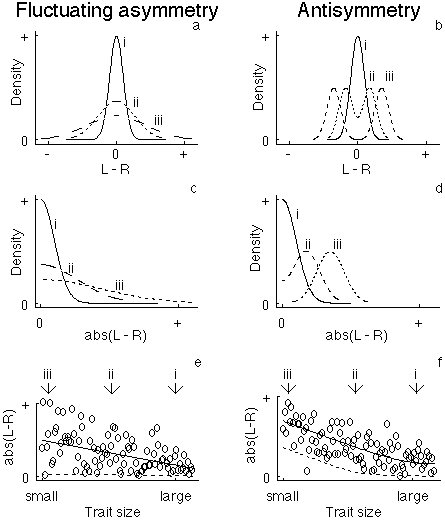
ABSTRACT: Fluctuating asymmetry (FA) has received much recent attention in studies of the evolution of sexual signaling systems. Tests apparently showing that symmetry decreases as individual condition decreases have bolstered the view that FA plays a significant role in the evolution of sexual signals. However, a closer inspection of several examples of bilateral variation as a function of trait size (a correlate of condition) suggests a different pattern of variation. Rather than fluctuating asymmetry, these traits suggest a pattern of size-dependent antisymmetry (a bimodal frequency distribution of R-L).
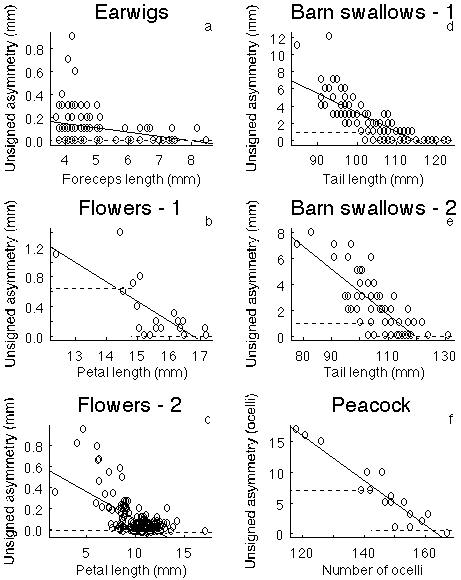
We introduce some quantitative methods to test for condition- or size-dependent FA. Our analyses reject pure FA for four of the five published data sets involving signals (the fifth is equivocal), but confirm the presence of size-dependent FA in one non-signaling trait. In the studies not conforming to FA, the data appear to fit more closely a pattern of antisymmetry in individuals with smaller signalling traits. Our results thus suggest that current discussions and conclusions about the role of FA in the evolution of signaling systems should be reconsidered. More specifically, we note that condition-dependent antisymmetry offers a more reliable indicator than condition-dependent FA. We caution, however, that additional work will be needed to determine whether the pattern is general and not an artifact of some kind. Our method of analysis could usefully be applied to studies of other continuous factors expected to be correlated with asymmetries, including heterozygosity, inbreeding, and environmental stress. Finally, we suggest that anti-symmetry may have commonly been mistaken for FA in a variety of cases dealing with a variety of problems.
FIG. 1. Hypothetical examples depicting effects of increasing fluctuating asymmetry and antisymmetry on trait distributions. a) Frequency distributions of signed differences between left and right expressions of traits resulting from increased fluctuating asymmetry. Solid curve (i) least fluctuating asymmetry; long-dashed curve greatest (iii) fluctuating asymmetry. b) Frequency distributions of signed differences beetween left and right sides resulting from increased antisymmetry. Solid curve (i) least antisymmetry; long-dashed curve (iii) greatest antisymmetry. c and d) Frequency distributions of unsigned differences between left and right expressions of traits under increasing fluctuating asymmetry (c) and increasing antisymmetry (d). Curves come from the same distributions as the corresponding curves in a and b. e and f). Unsigned differences between left and right as functions of trait size (condition). Levels of asymmetry that correspond to levels depicted in upper panels are indicated by arrows. Solid curves reflect mean levels of asymmetry; dashed curves 5th percentiles of asymmetry. Data points were drawn at random from distributons of asymmetries appropriate for the levels of trait expression. |
 |
FIG. 2. Scatter plots of unsigned measures of asymmetry and mean trait expression. Solid lines were fit by least squares linear regression. Dashed lines represent 5th percentiles of the observations encompassed by their lengths. Percentiles were interpolated using function quantile in the S language (see Becker et al. 1988). Sources: (a) Figure 1 in Radesater and Halldorsdottir (1993); (b) Figure 2 in Moller (1995); (c) Figure 1a in Moller and Eriksson (1994); (d) Figure 1 in Moller (1990); (e) Figure 2a in Moller (1992); (f) Figure 1 in Manning and Hartley (1991). |
 |
A.R. Palmer
Publications List,
Asymmetry Page,
Home Page
Original material on this page copyright © A. Richard Palmer. All rights reserved.
(revised Nov. 4, 2002)