Biology 381
Pollution Biology
Department of Biological Sciences
University of Alberta
Edmonton, Alberta
|
Biology 381 |
| 15. The concept of multiple stresses. |
15.1 Required Reading and other announcements.
No required reading.
15.2 Experimental control.
Research using controlled environment conditions allows scientists to control most, if not all, environmental factors.
If all other environmental factors are controlled, then changes between two treatment groups must reflect either...
natural biological variation, or
Statistics allow us to make reasonable conclusions regarding the likelihood that natural biological variation or random variation will lead us to incorrect interpretations of experimental data.
A properly designed, carefully controlled experiment can provide concrete information about the effect of a particular pollutant on plant growth.
Is this type of information sufficient for a complete understanding of the phytotoxicity of a given pollutant?
When several pollutants occur together in nature, the potential exists for additive, multiplicative, antagonistic, and synergistic interactions.
15.3 Early studies on potential interaction between pollutants.
The potential for Interaction between O3 and SO2 on growth of Nicotiana tabacum (tobacco).
Low concentrations of either O3 or SO2 did not produce foliar damage symptoms.
When the two pollutants were supplied together (at the same low concentrations), 23-48% of leaves showed foliar injury typical of ozone injury.
Interaction between O3 and SO2 on growth of other crop species.
Sulphur dioxide/ozone concentrations (ppm) Plant species 0.5/0.05 0.1/0.1 0.25/0.1 0.5/0.1 Alfalfa - + + + Brassica + + 0 0 Broccoli 0 0 0 + Radish 0 + + + Tomato 0 - 0 0 Tobacco + 0 + + A summary of the effects of sulfur dioxide and ozone mixtures on foliar injury. Data from Tingey et al., 1973. Cited in Reinert et al., 1975. +, injury greater than additive. 0, injury equal to additive. -, injury less than additive.
The type of interaction depends on
15.4 The additive and multiplicative models. Defining the lack of interaction.
In early studies, the toxic effects of pollutants were said to be additive if the growth reduction under conditions of multiple pollutant stress (expressed as a fraction of control growth) was equal to the sum of growth reductions produced by the individual pollutants in isolation).
Treatment Growth
(% of control)Growth Reduction Control 100 0 Ozone alone 80 20 SO2 alone 80 20 Ozone plus SO2 60 40 The additive model:
Expected growth reduction for combined treatment:
(0.20 + 0.20) = 0.40Expected growth for combined treatment:
1.00 -(0.20 + 0.20) = 0.60In later studies, the effect of pollutants were said to be additive if relative growth under conditions of multiple pollutant stress (expressed as a fraction of control growth) was equal to the product of the relative yields produced by the individual metals in isolation.
Treatment Growth
(% of control)Growth Reduction Control 100 0 Ozone alone 80 20 SO2 alone 80 20 Ozone plus SO2 64 36 Multiplicative model:
Expected growth for combined treatment:
(0.80 x 0.80) = 0.64Expected growth reduction for combined treatment:
1.00 - (0.80 x 0.80) = 0.36The multiplicative model is now the most commonly accepted model that describes the lack of interaction.
15.5 Defining antagonistic and synergistic interactions.
Synergistic effects: Relative growth < Multiplicative
Antagonistic effects: Relative growth > Multiplicative.
The definitions of "additive" have not always been made explicit in the current literature.
Statistical treatment of interaction studies has also been largely lacking.
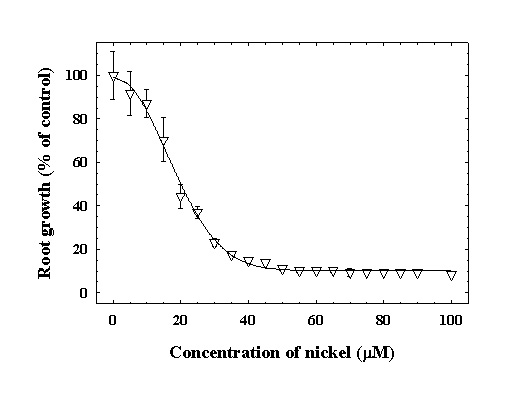
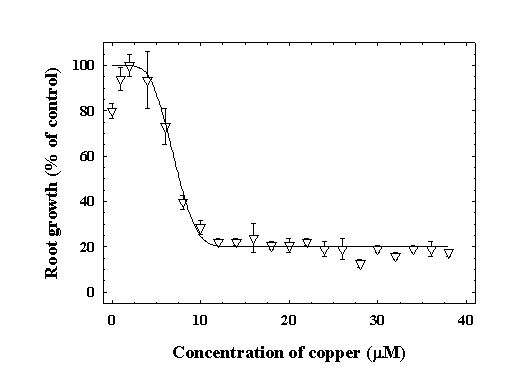
15.6 Dose-response.
Taylor, Unpublished results.
Features of dose-response relationships
Taylor, Unpublished results.
Most studies on pollutant interactions fail to make full use of the full dose response relationship.
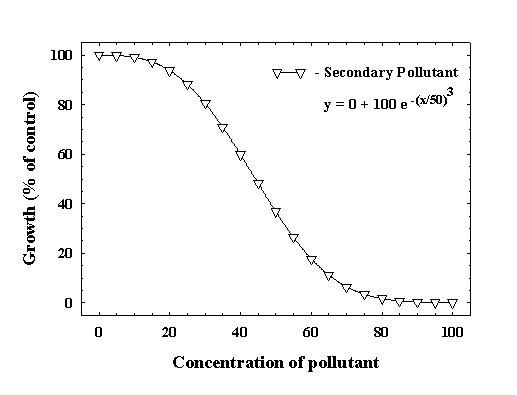
15.7 Modeling the additive and multiplicative models, antagonistic, and synergistic interactions.
Full dose response (100% - 0%)
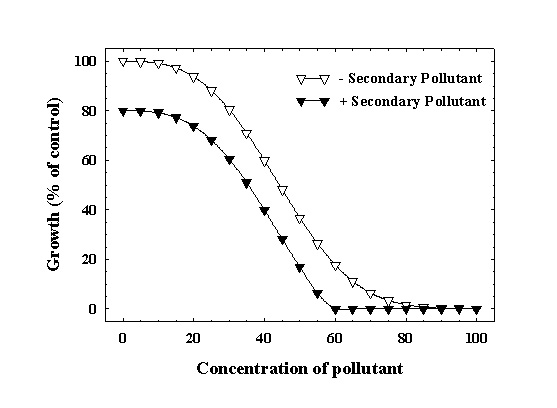
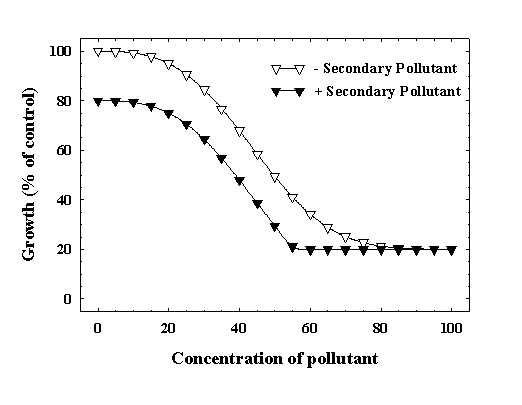
How would the additive and multiplicative models differ in terms of their predictions of growth when a second pollutant is added to the system?
The additive model, full dose response (100% - 0%).
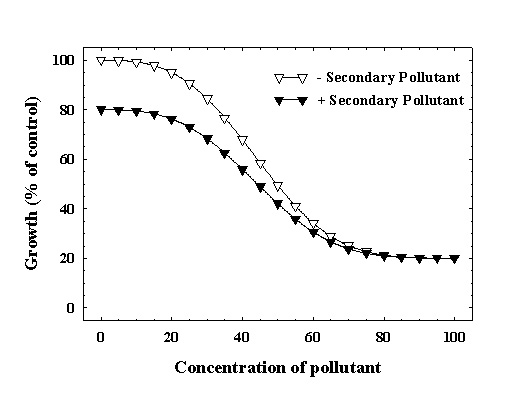
The multiplicative model, full dose response (100% - 0%).
Differences in the predictions of the two models seem small but, we might want to refine the data somewhat to make it more realistic.
It will be virtually impossible to achieve 0% growth under experimental conditions.
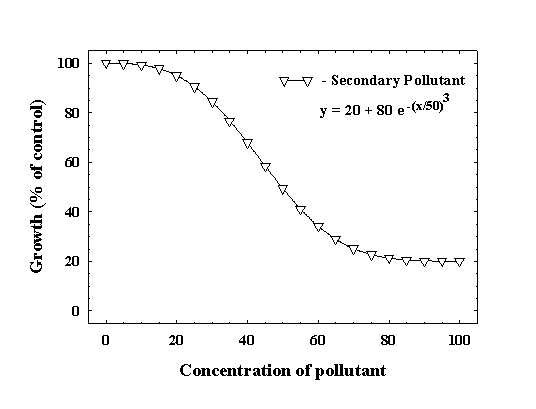
Restricted dose response (100% - 20%).
What would the two models predict with this restrictive assumption?
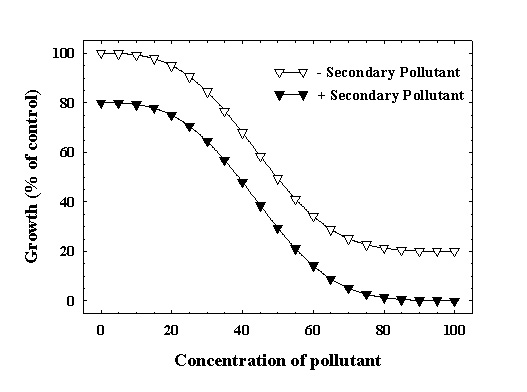
The additive model, restricted dose response (100% - 20%).
The multiplicative model, restricted dose response (100% - 20%).
Both of these strict mathematical interpretations break the imposed assumption that growth cannot fall below 20% of control.
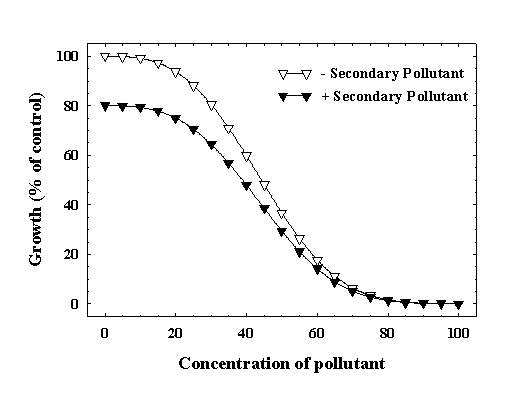
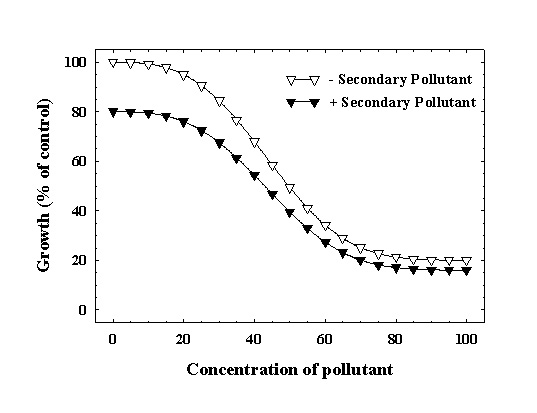
The additive model, restricted dose response (100 – 20%), 20% absolute minimum.
The multiplicative model, restricted dose response (100 – 20%), 20% absolute minimum.
We must be clear not only about the definition of our models, but also about the behaviour of the plant in response to pollution stress.
Growth values predicted at pollution level 60 by the various interaction models, with and without our biological assumptions.
Predicted growth (% of control) at pollution level 60
Dose Response Full (100%-0%) Restricted (100%-20%) Restricted (100%-20%) Assumptions 0% Abs Min 0% Abs Min 20% Abs Min 1o Pollutant alone 18% 34% 34% Combined (Add.) 0% 14% 20% Combined (Mult.) 14% 27% 31% Are the various simulated data scenarios realistic?
A restricted dose response with some absolute minimum is probably the most realistic.
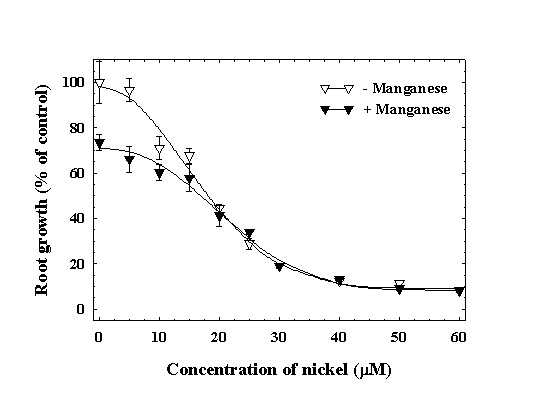
Manganese/Nickel Dose Responses.
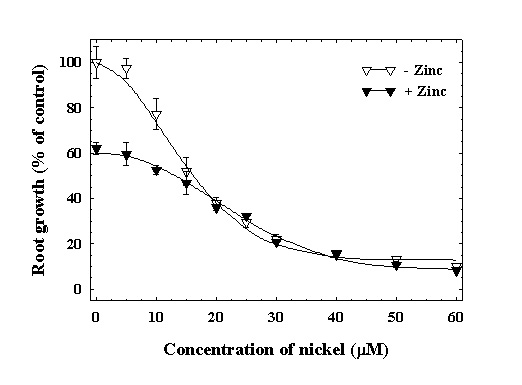
Zinc/Nickel Dose Responses.
If pollutant-pollutant interactions other than simple multiplicative interactions do occur in nature...
15.8 Additional world wide web information.
The World Wide Web has little information about the nature of interactions between pollutants. The following articles in the scientific literature provide detailed background if you are inclined to explore.
Taylor, G.J., 1989. Multiple metal stress in Triticum aestivum. Differentiation between additive, multiplicative, antagonistic, and synergistic effects. Can. J. Bot. 67: 2272-2276.
Taylor, G.J., Stadt, K.J., and Dale, M.R.T., 1991. Modelling the phytotoxicity of aluminum, cadmium, copper, manganese, nickel, and zinc using the Weibull frequency distribution. Can. J. Bot. 69: 359-367.
Taylor, G.J., Stadt, K.J., and Dale, M.R.T., 1992. Modelling the interactive effects of aluminum, cadmium, manganese, nickel and zinc stress using the Weibull frequency distribution. Environ. Exp. Bot. 12: 281-293.