Biology 381
Pollution Biology
Department of Biological Sciences
University of Alberta
Edmonton, Alberta
|
Biology 381 |
| 6. Acid precipitation, what goes up must come down. |
6.1 Required Reading and other announcements.
No required reading.
6.2 Defining Acid Precipitation.
Acid rain, or acid precipitation is the name given to rain that is more acid than normal.
Acidity is a measure of the concentration of hydrogen ions (H+) in a system (pH = -log [H+]).
Pure, uncontaminated water is naturally acidic.
CO2 + H20 _______________ H2CO3
H2CO3 _______________ HCO3- + H+
HCO3- + H+ _______________ CO32- + 2H+
Thus, acid precipitation can also be defined as any precipitation with a pH of less than 5.6.
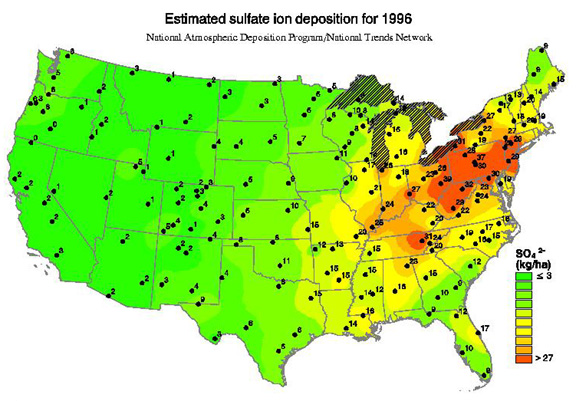
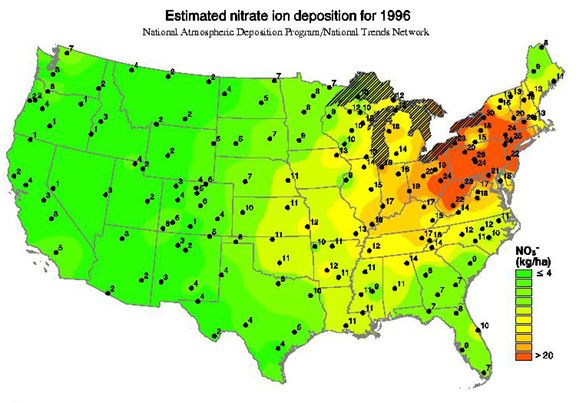
6.3 Acid precursors and the chemistry of acid formation.
Figure 14-1, Nebel (1987)
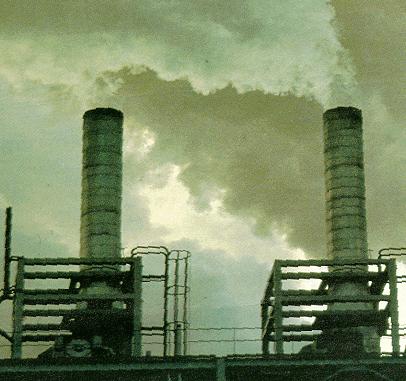
Sulphur dioxide (SO2) and nitrogen oxides (NOx) are produced through the combustion of fossil fuels, primarily for power and transportation.
Because formation of acids within the atmosphere can take up to several days, gaseous precursors are easily transported over long distances (100s of kilometres).
Eventually, SO2 and NOx react with water, oxygen and photooxidants in the atmosphere to form sulphuric acid and nitric acid respectively.
These acids dissolve in water to produce hydrogen ions (H+, acidity), sulphates, and nitrates.
Pollutants are cleansed from the atmosphere by precipitation, including rain, hail, fog, or snow (acid precipitation).
Some fallout of acid substances occurs without the aid of a precipitation event.
Acid deposition is the name given to the combined inputs of wet and dry deposition of acids.
A simple model of the chemistry of acid deposition. Figure 2.6, Park (1987)
The catalytic oxidation of SO2 and NOx is an important aspect of the acid precipitation problem. This process may last a few hours to several days depending on the supply of photooxidants (hence, sunny days).
6.4 When does acid deposition become an environmental problem?
If we are to evaluate the potential for acid precipitation problems, we must be concerned with three factors:
A source of SO2 or NOx emissions.
The number one source of SO2 emissions in the United States is coal-burning power plants. Metal smelters have been the largest single source in Canada.
Modified from http://btdqs.usgs.gov/jgordon/new-1.gif
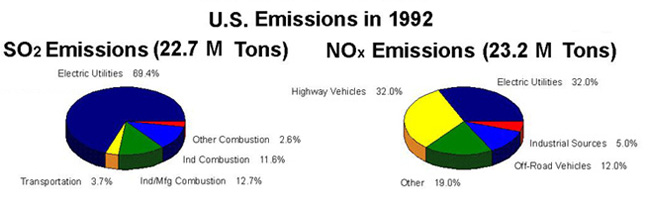
For the nitrogen oxides, transportation is the major source.
Emissions from the 31 states east of the Mississippi are estimated at 22.7 million tons of SO2, and 23.2 million tons of NOx a year (1992).
Emissions of SO2 and NOx from U.S. sources in 1992. http://www.epa.gov/acidrain/overview.html
Major sources of SO2 (2.6 M tonnes in 1995) in Canada include industry (70%), electrical utilities (22%), transportation (4%) and other sources (4%).
Major sources of NOx (2.0 M tonnes in 1995) in Canada include transportation (60%), industry (25%), electrical utilities (10%), and other sources (5%).
Federal legislation in both Canada and the United States have had a major impact on emissions.
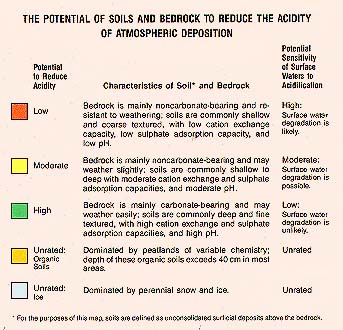
All natural ecosystems have an inherent capacity to neutralize acid inputs, and thus to resist acidification (buffering capacity).
H+ + OH- _______________ H2O
CaCO3 + 2H+ _______________ Ca2+ + CO2 + H2O
In a well buffered system, input of a large amount of acidity may have little or no impact on pH.
When the buffering capacity of the system is exhausted, however, small inputs of acidity will reduce pH dramatically.
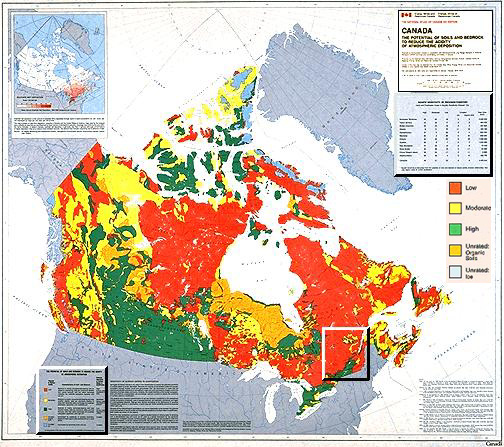
The potential of soils and bedrock in Canada to reduce the acidity of atmospheric deposition. Click for legend. http://www-nais.ccm.emr.ca/wwwnais/select/acid/english/html/eacid.html
4,000,000 km2 or 46% of Canada's land area is considered to have aquatic ecosystems which have a high sensitivity to acid precipitation.
Only 23% of Canada's lands are thought to contain aquatic ecosystems possessing low sensitivity to acid precipitation.
Percent distribution of aquatic sensitivity classes across Canada.
Province Aquatic sensitivity classes Unrated Province High Mod. Low Ice Organic B.C. 32 44 18 3 3 Alberta 6 11 70 <1 13 Saskatchewan 37 3 56 0 4 Manitoba 30 2 38 0 30 Ontario 34 20 20 0 26 Quebec 82 8 7 0 3 N. Brunswick 31 49 12 0 8 Nova Scotia 54 33 13 0 <1 P.E.I. 46 54 <1 0 <1 Newfoundland 56 30 4 0 10 NWT 48 25 18 6 3 Yukon 43 35 17 3 2 Canada 46 21 23 2 8 Source: Environment Canada.
6.5 Acid deposition in eastern Canada, a cause for concern?
The reason there is so much concern over acid precipitation in Ontario, Quebec, and the Maritimes is that all three ingredients are present.
Location of the 50 largest sources of SO2 emissions in the eastern United States in 1982.
Figure 14-17, Nebel (1987)
Dominant patterns of air flow across the United States. Figure 9.1, Park (1987).
Canadian policy analysts in the 1980's recognized that acid deposition in eastern Canada was largely due to acid precursors emitted in the United States. Put yourself in their shoes.
Would you recommend that we lobby for action in the United States or concentrate on our own sources of emissions?
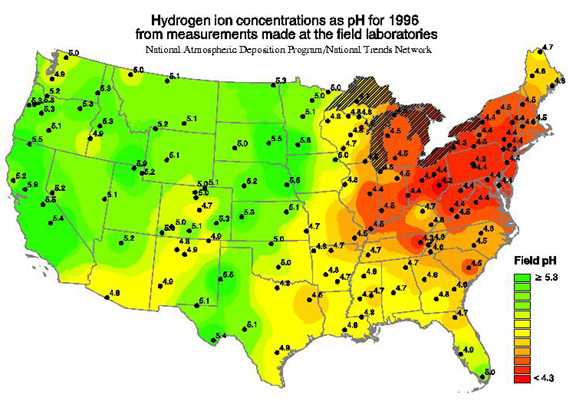
6.5 The distribution of acid precipitation in North America.
Distribution of acid precipitation across North America (mid 1980s).
Figure 14-8, Nebel (1987).
http://nadp.sws.uiuc.edu/isopleths/
Precipitation over much of eastern North America is ten times more acidic than pure rainwater.
Precipitation over much of eastern North America is 100 times more acidic than that from remote arctic regions.
6.6 The Worldwide distribution of Acid Precipitation.
The global distribution of acid precipitation (early 1980's). Figure 1.1, Park, 1987
6.7 A joint U.S./Canada acid deposition control program.
Canada and the U.S. signed the Canada-United States Air Quality Agreement in 1991, extending previous efforts to control acid deposition.
In 1985, Canada launched an acid rain control program that led to a 54% reduction in emissions of SO2 in the eastern provinces.
It subsequently established a smaller Sulphur Oxide Management Area (SOMA) in the southeast, where emissions are to be capped at 1.75 million tons/year effective in 2000.
By 1996, SO2 emissions in the SOMA were already 29% below that cap.
The U.S. has cut emissions by 30% since 1980 under the U.S. Clean Air Act (1990). By 2010, when the U.S. Acid Rain Program is fully implemented, emissions should be down by 40%.
In contrast, NOx emissions in the U.S. and Canada have been relatively stable over the same period.
Even with full implementation of the the Canada-United States Air Quality Agreement, some 800,000 km2 will receive harmful levels of acid deposition.
While levels of acid deposition have been declining, it has been estimated that a 75% reduction in emissions from both Canada and the United States would be required to protect all ecosystems.
6.8 Additional world wide web information.
Executive summary of the 1996 Progress Report for the U.S.-Canada Air Quality Agreement. This report reviews acid rain control programs, emissions forecasts, and scientific research. It also discusses new areas of concern, such as ground-level ozone (smog) and air toxins.
The potential of Canada's soils and bedrock to buffer acid deposition. An assessment of the sensitivity of Canadian ecosystems to acid deposition based upon analysis of underlying bedrock.
The United States Acid Rain Program. The U.S. Environmental Protection Agency has implemented a model program that makes use of market devices to control acid deposition. The program has been extremely successful.
Monitoring acid deposition in the United States. The U.S. National Atmospheric Deposition Program/National Trends Network (NADP/NTN) is a network of monitoring sites. They have done a superb job of making atmospheric deposition data available to the public.
Pollution Matrix, a Scandinavian perspective. Internationella Miljöinstitutet, located in Lund, Sweden provides a wealth of data on sources and impacts of atmospheric pollutants.